
The price of the creator economy, measured monthly
What a subscription actually costs, published every month and frozen when the month closes.
$8.30per month
What a subscription costs after discountsn = 421 12.9% since Aug 25
LuvsOne tracks creator pricing to answer one question: is this subscription worth it?
Headline numbers
March 2026 in six numbers
Every month we publish what a subscription actually costs after the discounts most creators run. Each month is frozen when it closes, so a figure quoted today still reads the same in a year.
Key numbers
The median creator subscription costs $6.40 a month ($8.30 on average), per the March 2026 release of the Luvs Creator Price Index.
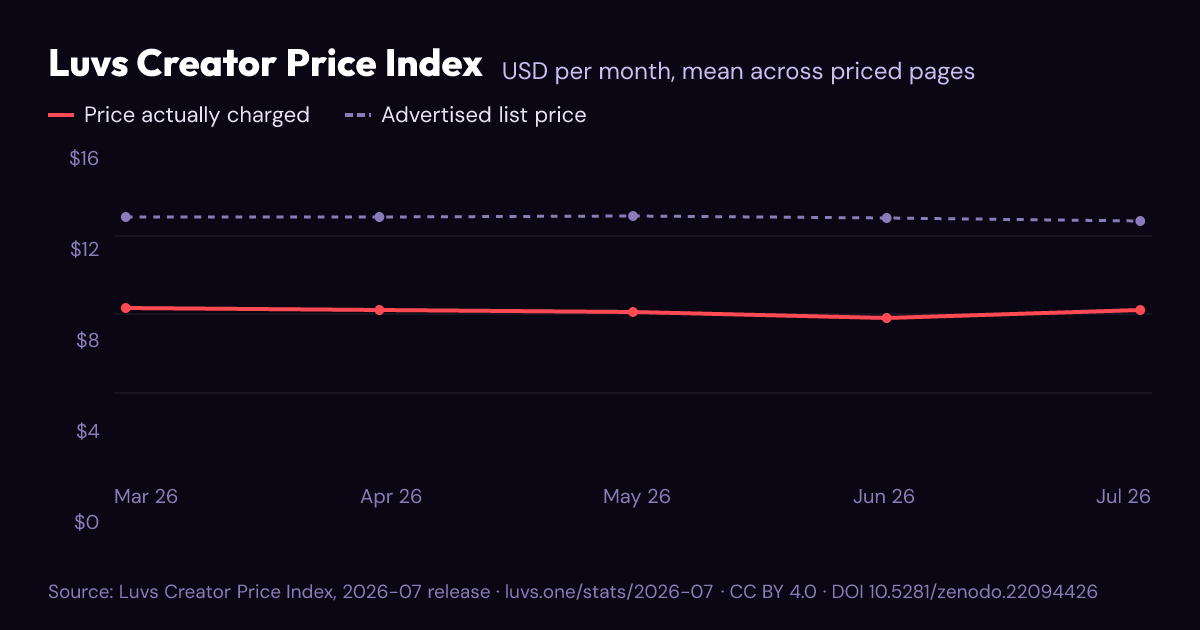
The average price actually charged is $8.30 a month, against $12.93 advertised.
55% of paid pages run a discount. The median discount is 55%.
The top 1 percent of creators hold 20% of all likes (Gini coefficient 0.57).
Computed on 421 paid pages with visible pricing · Methodology · CC BY 4.0, free to reuse with attribution
The series
Every month we have, side by side
The denominator
Free to follow, or paid
Share of subscription pages that are free to follow versus paid, measured monthly.
Every price figure below this one describes paid pages only. Pages whose type could not be determined in the month are left out of the split rather than counted as free.
free to follow paid
The shape of the price
What a paid page actually charges
The centre and the spread of paid subscription prices this month, in fixed bands that never move between releases.
The median is the number to quote. A handful of very expensive pages pull the mean above what almost anyone pays, so the two are always printed together.
- Cheapest tenth (P10)$3.50
- Middle (P50)$6.40
- Priciest tenth (P90)$15.00
- $0.01 to $4.9932.5%
- $5 to $9.9940.4%
- $10 to $14.9916.6%
- $15 to $19.995.9%
- $20 to $29.992.9%
- $30 to $49.991.2%
- $50 and up0.5%
More paid pages sit in $5 to $9.99 than in any other band.
For researchers
How unevenly attention is spread
How concentrated audience attention is across creators, measured by likes. This is an engagement measure, not an income measure.
Attention inequality
How likes are spread across the published catalogue
Share of all likes
The bottom half of the catalogue holds 16% of all likes. The top 10% hold 49%.
Gini 0 would mean every creator gets the same share of the likes. Gini 1 would mean a single creator gets all of them.
Likes measure who gets looked at, not who gets paid. Nothing here supports a claim about what creators earn.
- 5%Aug 25
- 20%Mar 26
The catalogue behind it
Photos published
Videos published
Posts holding them
Live streams aired
Likes collected
Advertised against real
What the sticker price hides
How much of the paid market runs a promotion in the month, and how deep those promotions cut.
Pricing by niche
What each niche really costs
Median paid subscription price by top level category. A category needs at least 15 priced profiles to appear at all.
| DNA niche | Real / mo | Advertised | Median | n |
|---|---|---|---|---|
| Fetish Focus | $8.71 | $12.48 | $7.50 | 94 |
| Hardcore Performer | $7.94 | $12.38 | $6.39 | 70 |
| Girlfriend Experience | $8.04 | $14.17 | $5.00 | 53 |
| Casual Real | $6.82 | $13.55 | $5.00 | 44 |
| Fitness And Sporty | $7.78 | $13.23 | $7.00 | 39 |
| Roleplay And Cosplay | $12.53 | $14.34 | $8.00 | 25 |
| Luxury Glam | $7.72 | $13.31 | $6.00 | 16 |
| Tattooed | $8.26 | $11.57 | $6.35 | 16 |
| Mature Seduction | $8.56 | $12.23 | $5.99 | 17 |
| Alternative | $7.34 | $12.41 | $6.66 | 15 |
Every category name opens its own browse page.
Country and score
Where they are, and how good they are
Where creators are
- United States$8.65144
- United Kingdom$8.1344
- Colombian/a16
- Romania$7.1216
- Canadan/a15



How the catalogue scores
No scores existed at the close of this month.
Every month keeps its own address
Computed once when the month closes, then never revised.
Not measured this month
Printed as the generator recorded it, so nothing is quietly zero
- discount_age_unavailable: the panel had no usable price coverage in 2025-12, so a 90-day run cannot be distinguished from a new discount
- price_changes_unavailable: the panel had no usable price coverage in 2026-02, so a price change cannot be told apart from a first observation
- score_distribution_unavailable: 8 creators carried a LUVS score at the close of this month, below the 15 needed to publish a distribution
Free for journalism and research. Attribution with a link is all we ask.
Download and attribute
March 2026 release, CC BY 4.0
Every release carries schema.org Dataset markup, so it is eligible for Google Dataset Search. How the numbers are produced is in the methodology.
Public API, v1
Read-only, aggregates only, no key required
- GET/api/v1/price-indexthe monthly series
- GET/api/v1/summaryheadline numbers
- GET/api/v1/discountsdiscount aggregates
- GET/api/v1/inequalitygini, lorenz, shares
- GET/api/v1/nichespricing by DNA
- GET/api/v1/countriespricing by country
- GET/api/v1/price-index.csvthe series as CSV
Add ?release=2026-03 to any endpoint to pin it to a frozen month. No per-creator fields are exposed, and a breakdown appears only where at least 15 profiles back it.
Example response
GET https://luvs.one/api/v1/price-index

{
  "release": "2026-03",
  "frozen_at": "2026-08-20T16:10:29.000Z",
  "series": [
    { "month": "2026-03",
      "avg_real": 8.3,
      "avg_advertised": 12.93,
      "median": 6.4,
      "pct_on_discount": 55.34,
      "n": 421 }
  ],
  "license": "CC-BY-4.0",
  "source": "https://luvs.one/stats"
}
For journalists and researchers
Working on a story or a paper about the creator economy? We pull custom aggregates from the full pricing and engagement history behind the published catalogue. Always free, always with the methodology attached.